Useful Tableau Public Vizzes
Tableau Public is a collection of vizzes that people have built and published on Tableau Cloud. It's an incredibly useful resource for anyone trying to learn Tableau or looking to improve their Tableau skills. It can be used as inspiration, for learning new techniques, and for seeing just how far Tableau can be pushed in creating visualisation art. Highly recommended.
Below are some of the ones I find most useful, and that I return to again and again.
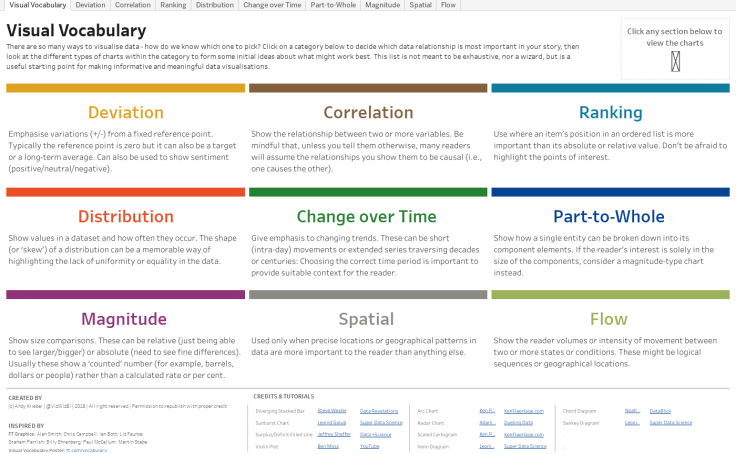
The Visual Vocabulary by Andy Kriebel
CREATED BY: Andy Kriebel | INSPIRED BY: The Financial Times Visual Vocabulary #VisualVocabulary NOTE: Do not redistribute without my permission.
CREATED BY: Andy Kriebel | INSPIRED BY: The Financial Times Visual Vocabulary #VisualVocabulary NOTE: Do not redistribute without my permission.
The Tableau Chart Builder by Jeff Plattner
The Tableau Chart BuilderAdditional inspiration --> The Tableau Chart Catalog by Kevin Flerlage (https://tinyurl.com/2p82d4xn) and Monday Minis by Lindsay Betzendahl (https://tinyurl.com/mr3vyc2c)
The Tableau Chart BuilderAdditional inspiration --> The Tableau Chart Catalog by Kevin Flerlage (https://tinyurl.com/2p82d4xn) and Monday Minis by Lindsay Betzendahl (https://tinyurl.com/mr3vyc2c)

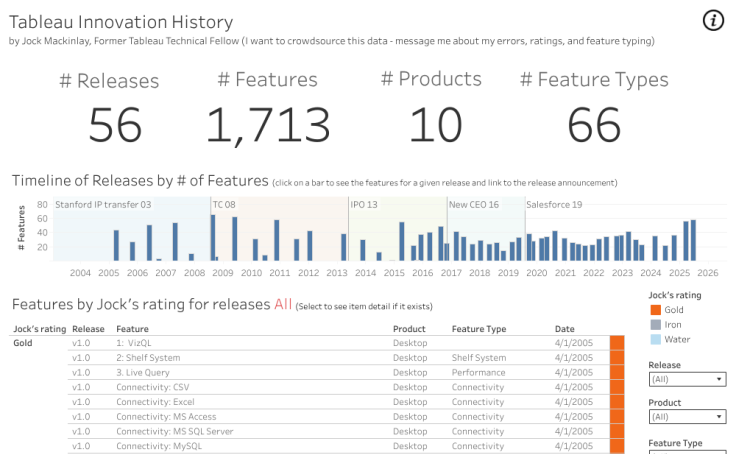
Tableau History by Jock Mackinlay
Tableau History
Tableau History
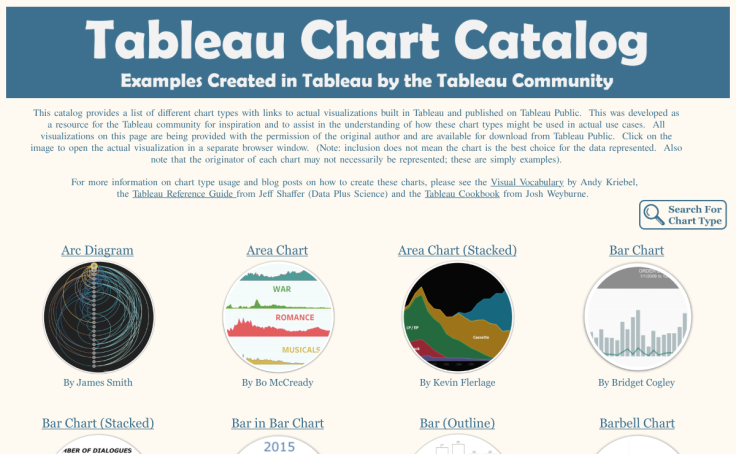
The Tableau Chart Catalog by Kevin Flerlage
The Tableau Chart Catalog #charttypes
The Tableau Chart Catalog #charttypes
Superstore Dashboard by Priya Padham
Superstore Dashboard
Superstore Dashboard